Measure system runtime with tuptime Stopwatch
Measure system runtime with tuptime Stopwatch
How long has the Linux server been running without rebooting? And how often has the system rebooted without you noticing? These questions and more are answered by the tuptime tool.
If a Linux system has been running for a long time, this is definitely proof of its stability, but – depending on the distribution – some updates might be waiting to install. Conversely, if the system reboots very frequently, there may be a configuration error – or maybe a hardware component is slowly deteriorating. On a workstation computer, such restarts are quickly noticed, but not necessarily on a remote server that is running quietly and well away from the action.
How long a system has been running continuously can be determined at the command line by a call to uptime. But you might also want to try tuptime [1], a similar tool whose name is based on a contraction of "total uptime." It outputs far more information, including valuable information in the form of the number of reboots and the kernel version used.
Installation
While uptime is available on almost every system, you need to install tuptime separately. Some distributions already have the tool in their repositories, such as Debian and Ubuntu. Arch Linux users will find tuptime in the AUR and CentOS users in the EPEL repository. On any Linux system, you can install the tool with the following:
$ curl -Ls https://git.io/tuptime-install.sh | sudo bash
Tuptime itself consists of a Python script and requires Python 3 with the modules sys, os, optparse, sqlite3, locale, platform, datetime, and logging. These modules should be preinstalled on most distributions. For more information about installation, see the box "In the Background."
In the Background
The system calls tuptime briefly during the boot and shutdown processes. In each case, the tool notes the system time. It is from the timestamps collected in this way that tuptime ultimately calculates the total runtime and all other values.
To make tuptime start automatically at boot and shutdown time, tuptime-install.sh sets up some startup scripts. For example, it sets up a corresponding service unit on a system with systemd. Besides systemd, the installation script also supports SysVinit and OpenRC. When using the installation script, tuptime also always runs under its own user account, named _tuptime.
If at some point the power should suddenly fail, tuptime would not notice anything. As a consequence, the timestamp for the shutdown would be missing, and this would prevent the tool from calculating the correct total runtime. For this reason, the installation script additionally sets up a cron job, which in turn ensures that tuptime is launched at regular intervals. All timestamps noted by tuptime end up in a small SQLite database, which is located below /var/lib/tuptime/tuptime.db by default.
Time Measurement
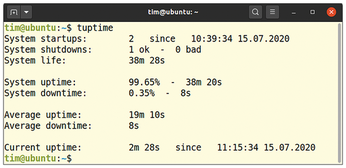
After setting up the program, query the current status via tuptime in the terminal. The tool already provides some basic information (Figure 1): At the very top; it shows the number of system starts. Next to it you can see the time and date since the software started counting the starts. Tuptime doesn't capture events before this date. To get a complete picture, set up the program as soon as possible after system installation.

Next, tuptime tells you how often the system has been shut down (System shutdowns). Pay special attention to the number of uncontrolled shutdowns labeled bad. If this figure increases rapidly, there is a major problem, for example an unstable power supply. System life indicates how long tuptime has been monitoring the system. If you installed tuptime directly after the installation of the distribution, this value corresponds to the time since the first boot.
This is followed by the total system uptime (System uptime) and the total time the computer was powered off (System downtime). If the percentage of downtime exceeds 50 percent, the computer was off longer than in operation. How long the system was in operation on average is indicated by the value following Average uptime. Similarly, Average downtime indicates how long the computer was switched off on average. The final value is the time since the last system start (Current uptime).
Display Options
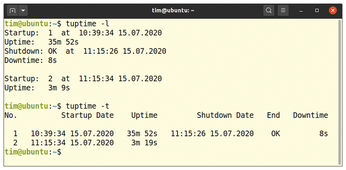
The tuptime -l command returns a list with all startup operations. In the list, you can see in detail when the system was in operation and for how long. If the list seems too confusing, tuptime -t converts the data to tabular form like shown in Figure 2. The additional -r parameter reverses the order; the last system start appears at the top.

If you still feel overwhelmed by the volume of information, the display can be limited to a certain period of time. For example, if you want to know when and for how long the system was active between July 27 and July 28, 2020, just call tuptime with the command:
$ tuptime --tsince=$(date --date="2020-07-27" +%s) --tuntil=$(date --date="2020-07-28" +%s)
The --tsince and --tuntil parameters each expect a timestamp that is calculated by date. Tuptime also outputs these timestamps with the -s parameter.
Alternatively, you can limit the output to very specific startup operations. For example, if you are interested in how long the system ran from the very first to the fifth logged startup, use the following:
$ tuptime --since 1 --until 5
Buy this article as PDF
(incl. VAT)
Buy Linux Magazine
Subscribe to our Linux Newsletters
Find Linux and Open Source Jobs
Subscribe to our ADMIN Newsletters
Support Our Work
Linux Magazine content is made possible with support from readers like you. Please consider contributing when you’ve found an article to be beneficial.

News
-
Systemd Fixes Bug While Facing New Challenger in GNU Shepherd
The systemd developers have fixed a really nasty bug amid the release of the new GNU Shepherd init system.
-
AlmaLinux 10.0 Beta Released
The AlmaLinux OS Foundation has announced the availability of AlmaLinux 10.0 Beta ("Purple Lion") for all supported devices with significant changes.
-
Gnome 47.2 Now Available
Gnome 47.2 is now available for general use but don't expect much in the way of newness, as this is all about improvements and bug fixes.
-
Latest Cinnamon Desktop Releases with a Bold New Look
Just in time for the holidays, the developer of the Cinnamon desktop has shipped a new release to help spice up your eggnog with new features and a new look.
-
Armbian 24.11 Released with Expanded Hardware Support
If you've been waiting for Armbian to support OrangePi 5 Max and Radxa ROCK 5B+, the wait is over.
-
SUSE Renames Several Products for Better Name Recognition
SUSE has been a very powerful player in the European market, but it knows it must branch out to gain serious traction. Will a name change do the trick?
-
ESET Discovers New Linux Malware
WolfsBane is an all-in-one malware that has hit the Linux operating system and includes a dropper, a launcher, and a backdoor.
-
New Linux Kernel Patch Allows Forcing a CPU Mitigation
Even when CPU mitigations can consume precious CPU cycles, it might not be a bad idea to allow users to enable them, even if your machine isn't vulnerable.
-
Red Hat Enterprise Linux 9.5 Released
Notify your friends, loved ones, and colleagues that the latest version of RHEL is available with plenty of enhancements.
-
Linux Sees Massive Performance Increase from a Single Line of Code
With one line of code, Intel was able to increase the performance of the Linux kernel by 4,000 percent.

