Stat-like command-line tools for admins
Get Info, Stat

© Lead Image © sony sivanandan, 123RF.com
ASCII tools can be life savers when they provide the only access you have to a misbehaving server. However, once you're on the node what do you do? In this article, we look at stat-like tools: vmstat, dstat, and mpstat.
Previously, I looked at some Top-like tools [1] that are useful when diagnosing misbehaving servers and you only have a shell to the node or a crash cart with no X Window System. When this happens, you have to rely on ASCII tools.
However, I don't rely just on Top-like tools to help me diagnose a problem; rather, I use them as a starting point if I can get a login. Top tells me a little of what is happening, but not everything. To get more detail, I turn to "stat" tools, particularly vmstat and vmstat-like tools.
The cool thing about these tools is that not only are they good for diagnosing problems, they also are good for examining application performance. In this article, I will show how I use vmstat and a similar tool called dstat. As a bonus, I will also discuss mpstat, which can be of great use, particularly for multiprocessing code.
vmstat
More often than not, when a node is misbehaving (performing badly), I've found that the node is swapping. One way to discover this is to use top and look at the swap usage. Although this method works reasonably well, I prefer to use vmstat [2](virtual memory statistics), because I can tell how actively the node is swapping – a little or a lot? Vmstat is already on virtually all Linux systems. I haven't seen one yet that didn't have it.
To begin, I'll start with a quick look of vmstat in action. Figure 1 shows the output of the command while a fairly computationally intensive Python application named test3.py was running.
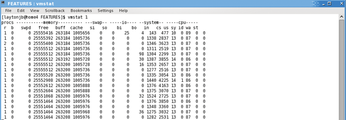
Although the goal of vmstat is to inform the user about the status of the physical and virtual memory of the system, it also provides information on "… information about processes, memory, paging, block IO, traps, and CPU activity" [3]. However, vmstat is a bit different from the top-like tools I mentioned previously: Rather than updating the screen so you see current values, vmstat prints a line of information at every time step, giving you a history of what is happening on the system. Generally, vmstat prints output to the screen until either you stop it or it has printed out the maximum number of lines of output you specify. Therefore, vmstat is often used to capture the state of the system over time. For example, you can use it to help track the effect of an application on the system, or you can use it to help diagnose system problems.
When I log in to a system that is misbehaving, I like to use the command vmstat 1, which tells vmstat to print out data every second and keep doing it forever (1 is the interval between data output). To do it for 10 seconds, I would use:
vmstat 1 10
For this command, 1 is the interval between printouts, and 10 is the number of lines of output. Vmstat has different modes you can invoke to get different or additional information. By default, vmstat runs in "virtual memory" mode, and no command-line options are needed; however, you can run it in other modes by adding command-line options.
- The
-dflag runs vmstat in "disk" mode, displaying information about the disks in the system. - The
-poption focuses on a partition. - The
-moption runs vmstat in "slab" mode. Slabinfo refers to caches of frequently used objects in the kernel, such as buffer heads, inodes, dentries, and so on. Vmstat displays information about some of these caches.
Because I'm interested in what is happening with memory, particularly if the node is swapping, I tend to run vmstat in the default virtual memory mode. The output from vmstat is pretty simple, and a few column headers (Table 1) help understand the information displayed.
Table 1
Vmstat Output
| Column | Output |
|---|---|
| procs | Processes |
| r |
Number of processes waiting for run time |
| b |
Number of processes in uninterruptible sleep |
| memory | Memory summary |
| swpd |
Amount of virtual memory used |
| free |
Amount of idle memory |
| buf |
Amount of memory used as buffers by the kernel |
| cache |
Amount of memory used as cache by the kernel |
| swap | Amount of memory swapped to/from the disk |
| si |
Amount of memory swapped in from disk (KiB/sec) |
| so |
Amount of memory swapped to disk (per second) |
| io | I/O sent/received from a block |
| bi |
Number of blocks received from a block device (blocks/sec) |
| bo |
Number of blocks sent to a block device (blocks/sec) |
| system | Number of interrupts and context switches for the system |
| in |
Number of interrupts per second, including the clock |
| cs |
Number of context switches per second |
| cpu | Summary of CPU usage |
| us |
Percent time spent running non-kernel code (i.e., user time, which includes "nice" time) |
| sy |
Percent time spent running kernel code (i.e., system time) |
| id |
Percent time spent idle |
| wa |
Percent CPU time spent waiting for I/O |
| st |
Percent time stolen from a virtual machine. Before Linux 2.6.11, unknown |
The first lines of output from vmstat are the averages since the last reboot, and unless you are interested in this information, it can be safely ignored. Subsequent lines are output according to the specified output interval; I usually specify one-second intervals if I'm searching for a problem.
You can change the units used in vmstat with the -S option. By default, vmstat uses kibibytes (KiB) [4], or 1024 bytes (-S K). You can change that to kilobytes (-S k), megabytes (-S m), or mebibytes (-S M). If you suspect server swapping (i.e., virtual memory usage), then look at the swap columns, labeled si and so. If you see non-zero numbers after the first line of output, you most likely have a node that is swapping.
From the screenshot in Figure 1, you can see that the swap columns are zero, so no swapping is taking place. The data in the next two columns, blocks in and out of the system, tell me if the application is doing a great deal of I/O, which could also be the cause of an apparent slowdown on the server.
If you want to get ambitious, you can plot vmstat output. VMSTAT Analyzer [5] graphs data from the vmstat logfile, and VMLoad [6] runs vmstat and creates CSV files that can be plotted in a spreadsheet or with gnuplot. However, none of these tools really met my needs, so I wrote my own Python script, vmstat_plotter [7] that takes vmstat data and plots it. Vmstat plotter only plots data that can be gathered over time. This means it can plot the data for VM, disk, device, slabinfo, and partition modes. If you try to plot the data for any other mode, the script fails miserably. Also, you need to use the default units (KiB; -S K) and use the -n option, which only prints the header once.
Web-vmstat
Although I am focusing on ASCII tools for diagnosing and examining Linux servers in this article, I did run across a capability related to vmstat that I want to mention. A tool named Web-vmstat [8] plots vmstat data obtained from a server, either local or remote, in your browser using websocketd. Although I won't go into it in depth, Web-vmstat does a pretty good job monitoring problem servers. For example, if a node has been exhibiting strange behavior, you might want to start up vmstat on the node using websocketd and display the data in your browser. I don't think I would capture information every second, but you could capture it every few seconds and then examine the graphs for spikes that might indicate a problem.
dstat
As was the case with Top, people have developed tools to replace or supplement vmstat. Dstat [9] is one of the most popular tools of this class. The website claims it can replace vmstat, iostat, netstat, and ifstat, with the ability to monitor a number of processes, ranging from processors to disks to networks. I tend to run dstat with the defaults when I start debugging a node, so I can get a good overall view of the state of the server. Figure 2 shows
dstat --io -s --top-io --top-bio 1 10
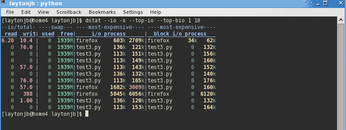
output while I ran some computationally intensive code. As you can see, dstat monitors CPU, disk, network, and virtual memory (paging) metrics by default, as well as some system statistics (interrupts and context switches, just like vmstat). Dstat also presents the output in color.
Although dstat is very similar to vmstat – it was designed to be a replacement for vmstat, after all – it has several additional options for measuring all kinds of system metrics. In the interest of time and space, I won't list them here, but you can read the dstat man page [10] for more information. Moreover, dstat is written in Python, so you can write your own plugins to measure whatever you want. Table 2 describes the five metrics reported by dstat in the default mode.
Table 2
Dstat Output
| Stat> | Output |
|---|---|
| CPU |
Resource utilization |
| usr |
Percent CPU resources devoted to user applications (user time). |
| sys |
Percent CPU resources devoted to the OS (system time). |
| idl |
Percent CPU resources devoted to idle time. |
| wai |
Percent CPU resources devoted to wait time. |
| hiq |
Percent CPU resources devoted to hardware interrupts. |
| siq |
Percent CPU resources devoted to software interrupts. |
| Disk |
Amount of data either read or written during an interval, including all data to all disks. |
| Network |
Amount of data received or sent during a time interval for all network interfaces. |
| Paging |
Number of pages swapped in or out during a time interval. |
| System |
Number of interrupts and context switches during a time interval. |
Dstat can also export its output to a CSV file for plotting with various tools, such as spreadsheets or gnuplot. To demonstrate the flexibility of dstat, I will show some simple command-line examples I use when diagnosing problems by focusing on disk I/O, network activity, and CPU usage.
Dstat is a bit better than vmstat in investigating disk I/O, with its ability to present an overall view or watch specific partitions or drives. In Figure 3, the
dstat -cdl -D sdc 1 10
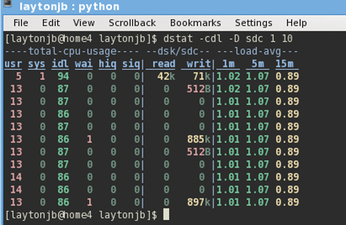
output lets me watch the CPU (-c), load (-l), and disk (sdc) for 10 seconds at one-second increments.
Note that although the node isn't doing much reading, it's doing a reasonable amount of writing. In the fifth interval, the system wrote 885KB to sdc, and in the 10th interval, it wrote 897kB. In many installations, the greatest part of I/O occurs on network filesystems, not on local disks.
Therefore, if the I/O pattern to network storage seems reasonable, you should check local I/O, in case the application is writing to something like /tmp, or maybe swapping, causing an unexpected slowdown.
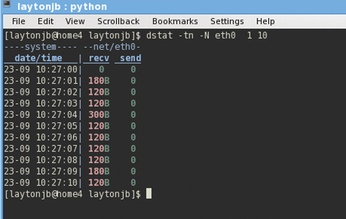
Diagnosing network issues is typically a tough issue, but with dstat, you can take a quick look at the overall network traffic – TCP (Ethernet) not IB (InfiniBand) traffic. One place to begin is to watch the network traffic on a specific network device. For example, assuming you have data or computational traffic over eth0, you can get an idea of network activity:
dstat -tn -N eth0 1 10
I added the time option (-t) and the network stats option (-n), then monitored the network device of interest (-N eth0) for 10 seconds at one-second intervals (Figure 4). The application that was running wasn't using the network and all of the I/O was local, but you can see that you get a reasonable overview of the amount of send and receive data on the device. Be sure to look at the dstat man page to see other network options.
Before looking at either the I/O stats or the network stats, I like to look at the CPU stats of a misbehaving server using dstat. This can tell me a lot very quickly. For example, if the user load is low, maybe a user application is swapping or doing a great deal of I/O over the network.
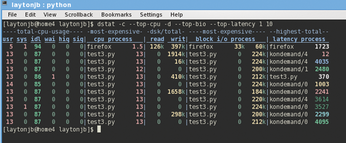
Another possibility is that the system is experiencing some latency issues. A few dstat options can give me an overall picture of what is happening with the CPUs on the system. Figure 5 shows the results of the
dstat -c --top-cpu -d --top-bio --top-latency 1 10
command I use quite often to check on CPU stats.
The options I chose are pretty simple, but they illustrate the flexibility of dstat. For example, I use the -c option to check on CPU usage (the first six columns in Figure 5) and the --top-cpu option to see the process using the most CPU time (second group in Figure 5 labeled cpu process).
The first line of output in this group is Firefox (this is my desktop). After that, it's the test3.py application. I also used the -d option for disk stats, because I might as well check the I/O while I'm watching the CPU.
These stats are in the third group from the left in Figure 5. It shows the total read and write I/O to the system in each time interval. In combination with -d, I used --top-bio, which shows the process that is doing the most block I/O (fourth group from the left labeled block i/o process), even though the output is in terms of bytes (KB). In this group, the most active block I/O process, regardless of read or write activity, is listed along with the read and write I/O for that process. In the simple example in Figure 5, the first process listed is Firefox, then the program test3.py.
The final option, --top-latency, lists the process with the greatest latency. The last group, labeled latencyprocess shows latency in milliseconds. For the sample output, the process with the largest latency is kondemand, which is a kernel thread that helps conserve power by reducing CPU speed if the CPU doesn't need to run at maximum speed.
For this desktop, I have four real cores and four hyperthread cores, and I'm really only running one computational program, so the other cores are throttled down, which points to kondemand as having high latency.
mpstat
One more tool I want to mention is not exactly along the lines of vmstat or dstat, but it has helped me when I'm helping a user with an application, particularly one that uses more than one core. The tool is part of Systat [11], and is called mpstat [12]. Mpstat is more like iostat or nfsiostat, and it gives perhaps more and better information about the CPUs than vmstat or dstat. Because virtually all systems today have more than one core, mpstat can be very useful in tracking CPU usage. I use it when I'm writing OpenMP [12] code and want to see how much of the core capability I'm using. Figure 6 shows the output from
mpstat 1 10
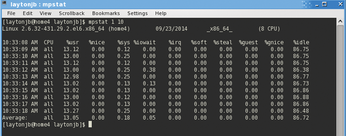
which outputs CPU statistics for 10 seconds at one-second intervals. The output first displays the system and the number of CPUs (eight, in this case), then starts printing the stats for all of the CPUs combined. The output is fairly similar to that of vmstat and dstat (Table 3).
Table 3
Mpstat Output
| Column | Output |
|---|---|
| CPU |
Processor number to which the output refers. In Figure 6, it refers to all processors combined. |
| %usr |
Percent CPU utilization by user applications. |
| %nice |
Percent CPU utilization by user applications using the "nice" priority. |
| %sys |
Percent CPU utilization at the system level (kernel). This does not include the time for servicing hardware or software interrupts. |
| %iowait |
Percent CPU spent idle during which the system had an outstanding I/O request. |
| %irq |
Percent CPU utilization spent servicing hardware interrupts. |
| %soft |
Percent CPU utilization spent servicing software interrupts. |
| %steal |
Percent CPU utilization spent in involuntary wait by the virtual CPU or CPUs while the hypervisor was servicing another virtual processor. |
| %guest |
Percent CPU utilization spent by the CPU or CPUs to run a virtual processor. |
| %gnice |
Percent CPU utilization spent by the CPU or CPUs to run a guest with a "nice" priority. |
| %idle |
Percent CPU utilization spent idle while the system did not have an outstanding I/O request. |
The user applications are using a little over 13% of the total CPU capability, and the system is using a little less than 0.25%. The remaining roughly 86+% is idle (close to seven of eight cores). To see the details for each processor, use:
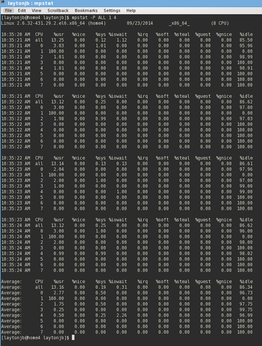
mpstat -P ALL
to show the same stats as in Figure 6, but for all of the CPU's combined and then for each core (Figure 7). I use this option to see if my programs using OpenMP code are using much of the CPU, which I hope reaches maximum core utilization.
Buy this article as PDF
(incl. VAT)
Buy Linux Magazine
Subscribe to our Linux Newsletters
Find Linux and Open Source Jobs
Subscribe to our ADMIN Newsletters
Support Our Work
Linux Magazine content is made possible with support from readers like you. Please consider contributing when you’ve found an article to be beneficial.

News
-
Plasma 6.3 Ready for Public Beta Testing
Plasma 6.3 will ship with KDE Gear 24.12.1 and KDE Frameworks 6.10, along with some new and exciting features.
-
Budgie 10.10 Scheduled for Q1 2025 with a Surprising Desktop Update
If Budgie is your desktop environment of choice, 2025 is going to be a great year for you.
-
Firefox 134 Offers Improvements for Linux Version
Fans of Linux and Firefox rejoice, as there's a new version available that includes some handy updates.
-
Serpent OS Arrives with a New Alpha Release
After months of silence, Ikey Doherty has released a new alpha for his Serpent OS.
-
HashiCorp Cofounder Unveils Ghostty, a Linux Terminal App
Ghostty is a new Linux terminal app that's fast, feature-rich, and offers a platform-native GUI while remaining cross-platform.
-
Fedora Asahi Remix 41 Available for Apple Silicon
If you have an Apple Silicon Mac and you're hoping to install Fedora, you're in luck because the latest release supports the M1 and M2 chips.
-
Systemd Fixes Bug While Facing New Challenger in GNU Shepherd
The systemd developers have fixed a really nasty bug amid the release of the new GNU Shepherd init system.
-
AlmaLinux 10.0 Beta Released
The AlmaLinux OS Foundation has announced the availability of AlmaLinux 10.0 Beta ("Purple Lion") for all supported devices with significant changes.
-
Gnome 47.2 Now Available
Gnome 47.2 is now available for general use but don't expect much in the way of newness, as this is all about improvements and bug fixes.
-
Latest Cinnamon Desktop Releases with a Bold New Look
Just in time for the holidays, the developer of the Cinnamon desktop has shipped a new release to help spice up your eggnog with new features and a new look.

